Our 2024 Q4 Investment Update
In our 2024 Q4 investment update, we’ve compiled a collection of charts that offer a snapshot of how investments have fared, tackle the questions our clients ask most often, and delve into the major themes currently dominating the news.
Periodic Table of Asset Class Returns
About this Slide: This illustration is for informational purposes only and is not the performance of any Brighton Jones client portfolio. It shows the performance of core market segments included within a typical Brighton Jones portfolio for the prior four quarters and trailing one-year period ending December 31, 2024. The included market segments, each represented by a different color, are sorted from highest to lowest based on performance for each period. Past performance is not a guarantee of future results.
Key Takeaway: For the 2024 calendar year, every market segment posted a positive total return, with US equities once again leading the charge. US Equities constitute the largest allocation within our diversified portfolios, so the persistence of US outperformance has been a welcome development. However, we have come to find over the years that sustained outperformance of the domestic stock market introduces a curious paradox. On one hand, it is clearly beneficial when the asset class with the largest allocation weight is the best performer. On the other hand, extended dominance by US equities often tempts investors to second guess the virtues of diversification, leaving other asset classes undervalued and underappreciated. This is where perspective matters. First, market leadership is inherently cyclical—it is important to remember that no asset class reigns supreme forever. Second, prolonged outperformance can inflate valuations, creating risks that may not be immediately apparent. We continue to believe the appropriate course of action lies in rebalancing portfolios by taking profits from outperforming assets and redeploying into areas that have lagged. Some of this rebalancing takes place tax efficiently inside the funds we own (e.g. reallocating from mega cap stocks to mid and small cap stocks), and in other cases it requires moving capital from one asset class to another (e.g. reallocating capital from equities to fixed income). In our view, rebalancing demonstrates the kind of contrarian thinking that’s central to long-term success. While it may feel counterintuitive, history shows that maintaining discipline, even when tempted by recent winners, is key to enduring investment performance.
In the final months of the year, the Federal Reserve moved decisively, trimming the Fed Funds rate target by 50 basis points in September, followed by 25 basis points each in November and December. Meanwhile, the political landscape shifted as the Republican party secured control of the White House, Senate, and House of Representatives in the November elections. These combined developments set off a chain reaction: long-term interest rates climbed sharply, with the 10-year Treasury yield rising from 3.7% to 4.6%, and the US dollar gained significant strength, as reflected in a 9% surge of a US Dollar tracking ETF (UUP) during the fourth quarter. In turn, asset classes with interest rate sensitivity (real estate and high-quality fixed income) and exposure to foreign currencies (international equities) suffered negative returns, diverging from continued positive performance from the US equity market.
Data Disclosures: Treasury Money Market: Fidelity Treasury Money Market. Short-Term Bond Index: Vanguard Short-Term Bond Index. Total Bond Market Index: Vanguard Total Bond Market Index. Inflation-Protected Treasuries: Vanguard Inflation-Protected Securities. Multisector Bond Strategy: PIMCO Income. Floating Rate Bonds: Fidelity Floating Rate. High Yield Bonds: PIMCO High Yield. Preferred Securities: Nuveen Preferred Securities. US Stocks: DFA US Core Equity I. Foreign Stocks: DFA World ex US Core Equity. Global Real Estate: DFA Global Real Estate. Data source: Morningstar Direct.
Asset Class Performance: Current Bull Market Run
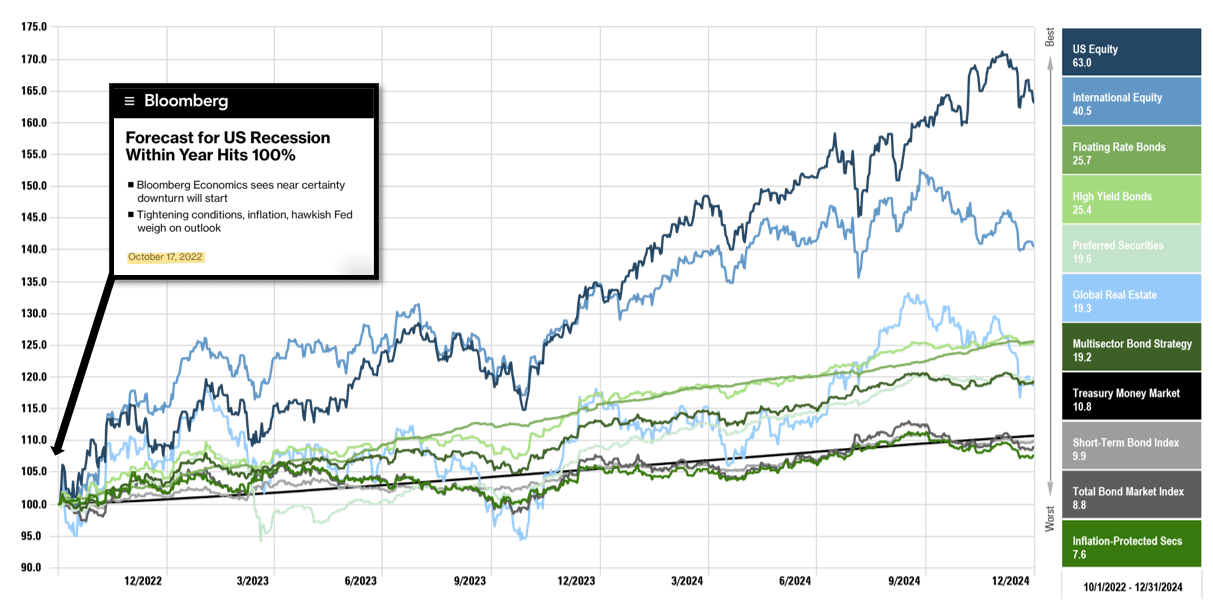
About this Slide: This chart shows performance of core market segments since September 30, 2022—the low point in the current market cycle. This illustration is for informational purposes only and is not the performance of any Brighton Jones client portfolio. Past performance is not a guarantee of future results.
Key Takeaway(s): This illustration is a reminder that bull markets are born in pessimism, taking root when news is bad, sentiment is poor, and securities prices reflect a dim outlook. Moreover, it underscores that successful investing isn’t about waiting for the all-clear signal from Bloomberg, The Wall Street Journal, Financial Times, or similar publications; it’s about discerning value while others are preoccupied with worry and doubt.
The current bull market has been running for nine quarters, and with few exceptions, performance across asset classes has followed the expected pattern of higher-risk investments generally outperforming lower-risk ones: global equity strategies (blue) have led the way, outpacing high-income strategies (green), which in turn have outperformed capital preservation strategies (gray).
Interestingly, these returns materialized even as inflation remained stickier than expected, interest rates were kept higher than most anticipated, and the yield curve experienced its longest inversion in modern times—spanning 783 days. This demonstrates that you can be right about many of the inputs that feed into an economic or market forecast and still be wrong about the final output—the US has not experienced an economic downturn and investment returns have been robust.
Data Disclosures: Treasury Money Market: Fidelity Treasury Money Market. Short-Term Bond Index: Vanguard Short-Term Bond Index. Total Bond Market Index: Vanguard Total Bond Market Index. Inflation-Protected Treasuries: Vanguard Inflation-Protected Securities. Multisector Bond Strategy: PIMCO Income. Floating Rate Bonds: Fidelity Floating Rate. High Yield Bonds: PIMCO High Yield. Preferred Securities: Nuveen Preferred Securities. US Stocks: DFA US Core Equity I. Foreign Stocks: DFA World ex US Core Equity. Global Real Estate: DFA Global Real Estate. Data source: Morningstar Direct.
Interest Rates: US Treasury Yield Curve
About this Chart: This chart shows the change in the shape of the yield curve from the time of the Federal Reserve’s first interest rate cut in September (blue) to year end (yellow). Past performance is not a guarantee of future results.
Key Takeaways: The Federal Reserve lowered the Fed Funds interest rate target by 50 basis points in September, 25 basis points in November, and 25 basis points again in December.
Leading up to the widely anticipated rate cuts, conventional wisdom held that investors should extend bond maturities to lock in higher interest rates before they decline.
However, those who acted on this conventional narrative were whiplashed by sharply rising long-term interest rates (given the inverse relationship between bond prices and interest rate changes), even as short-term interest rates declined in lockstep with the Federal Reserve’s rate cuts.
One underappreciated aspect of investing is that it is equally as difficult to successfully time the bond market based on interest rate forecasts as it is to time the stock market based on economic predictions.
One of our core beliefs for fixed income investing is that it is paramount to align the timing and amounts of anticipated cash needs from a portfolio with the duration profile of the bonds and bond strategies we own. This approach to fixed income investing is called “liability immunization” and it is often deployed by pension funds, insurance companies, and other institutional investors as a way to neutralize a portfolio’s sensitivity to unexpected changes in interest rates.
Data Disclosures: Source: US Treasury
10-Year Treasury Yield Change After 1st Rate Cut
About this Chart: There have been seven interest rate-cutting cycles in the past 35 years. This chart illustrates the change in the 10-year Treasury yield starting from the date of the first rate cut in each cycle. Past performance is not a guarantee of future results.
Key Takeaways: We previously commented that conventional wisdom has traditionally suggested that investors should extend bond maturities to lock in higher interest rates ahead of the Federal Reserve lowering its target for the Fed Funds rate. One of our investment principles is that testable ideas should be tested—meaning we should use data where possible to guide our actions rather than acting upon well-sounding ideas and conventional wisdom. Putting this principle into practice, we analyzed historical data to see how the 10-year Treasury yield behaved during previous rate-cutting cycles.
Historical data shows investors should not be surprised that the 10-year Treasury yield increased after the first rate cut in September—it has happened before, with the odds of a rise 30 days after the initial cut amounting to a coin flip. Given the performance of bonds is inversely related to movements in interest rates, tactically repositioning bond portfolios in response to interest rate cuts did not offer a high probability of success.
Data Disclosures: Source: US Treasury
Can Artificial Intelligence Pick Winning Stocks?
About this Slide: This illustration is for informational purposes only and is not the performance of any Brighton Jones client portfolio. Past performance is not a guarantee of future results.
In November of 2022 the artificial intelligence company OpenAI released to the public a free version of its AI-powered chatbot, ChatGPT. The program reached one million downloads in just five days, shattering comparable milestones set by other popular applications, including Twitter, Facebook, Spotify, Instagram, Netflix, etc. The release of ChatGPT provided individuals and companies around the world with the ability to experience the power of artificial intelligence firsthand like never before. As various AI applications were shown to pass legal exams, draft business plans, produce travel itineraries, summarize lengthy text documents, and much more, many curious observers started to wonder if the technology could be used to pick winning stocks.
While the use of artificial intelligence in everyday life has broadened to a wider audience with the release of ChatGPT, the investment world has been using various forms of algorithm trading, machine learning, and artificial intelligence for decades. To that end, the use of computers to collect and synthesize information faster and more accurately is not a new phenomenon to financial institutions seeking a winning edge in a fiercely competitive marketplace.
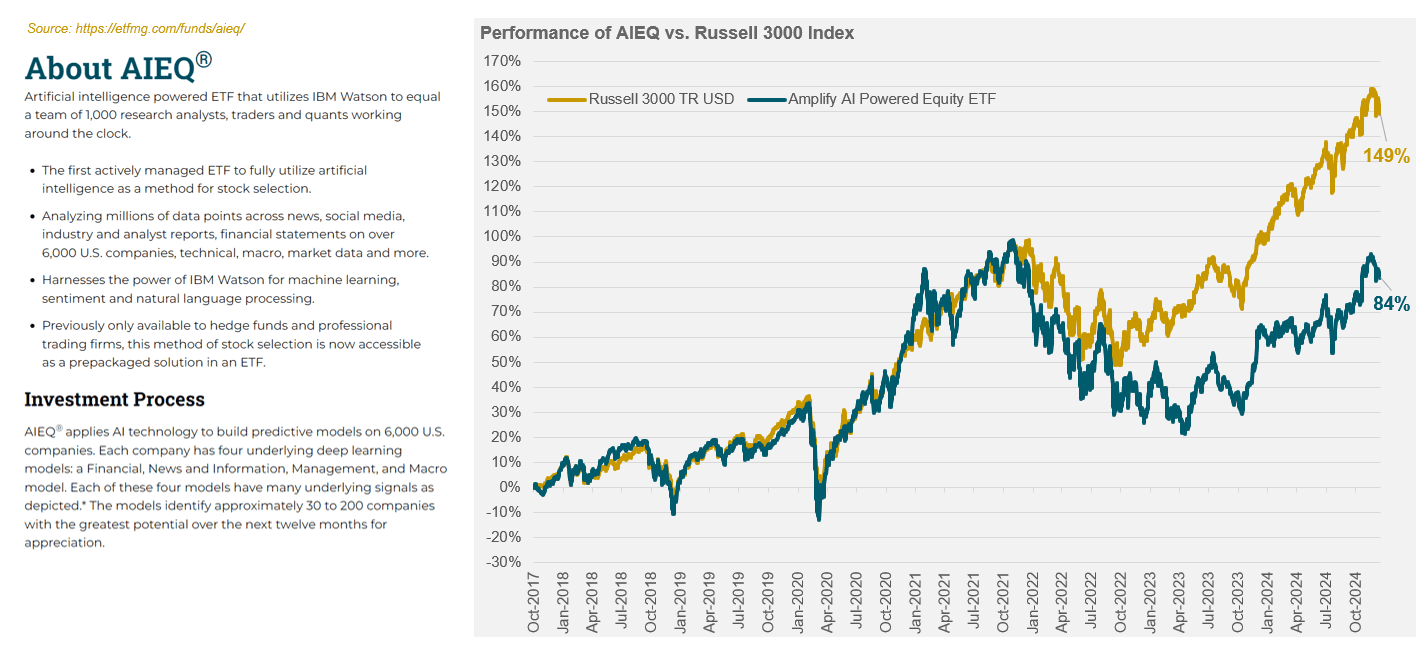
This slide compares the performance of the broad US equity market index (Russell 3000) to an Artificial Intelligence powered fund that was launched in 2017 (the longest publicly available track record of a fund still operating today that explicitly uses artificial intelligence to pick stocks). While the strategy and process description of the fund might sound alluring, the investment results are not—the AI-powered fund provided a cumulative return of 84% compared to 149% for the broad market index (since the inception date of the AI-powered fund).
Key Takeaway(s): There will always be a “newer, better, and faster” way to gather and synthesize information. It started with computers, improved with the internet, and continues with machine learning and artificial intelligence. If none of these previous breakthroughs created a sustainable advantage for picking stocks and outperforming the market, why will the latest iteration?
Artificial Intelligence is a tool, just like the internet, that every individual and company can use to their benefit to create some efficiencies and potentially uncover some opportunities. But if everyone has access to this tool, is it really a differentiator that can provide an investor with a useful and sustainable advantage over all other investors?
In our view, having tens of thousands of AI-applications working independently from one another to process all forms of information is only going to make financial markets more efficient, not less.
While Artificial Intelligence has the potential to profoundly impact our everyday lives, the fiercely competitive nature of financial markets is likely to prevent any single AI-based investment strategy from maintaining a sustainable edge over all others trying to do the same.
Data Disclosures: Data source: Morningstar Direct.
Calibrating Portfolio Positioning
About this Slide: This illustration is for informational purposes only. Past performance is not a guarantee of future results.
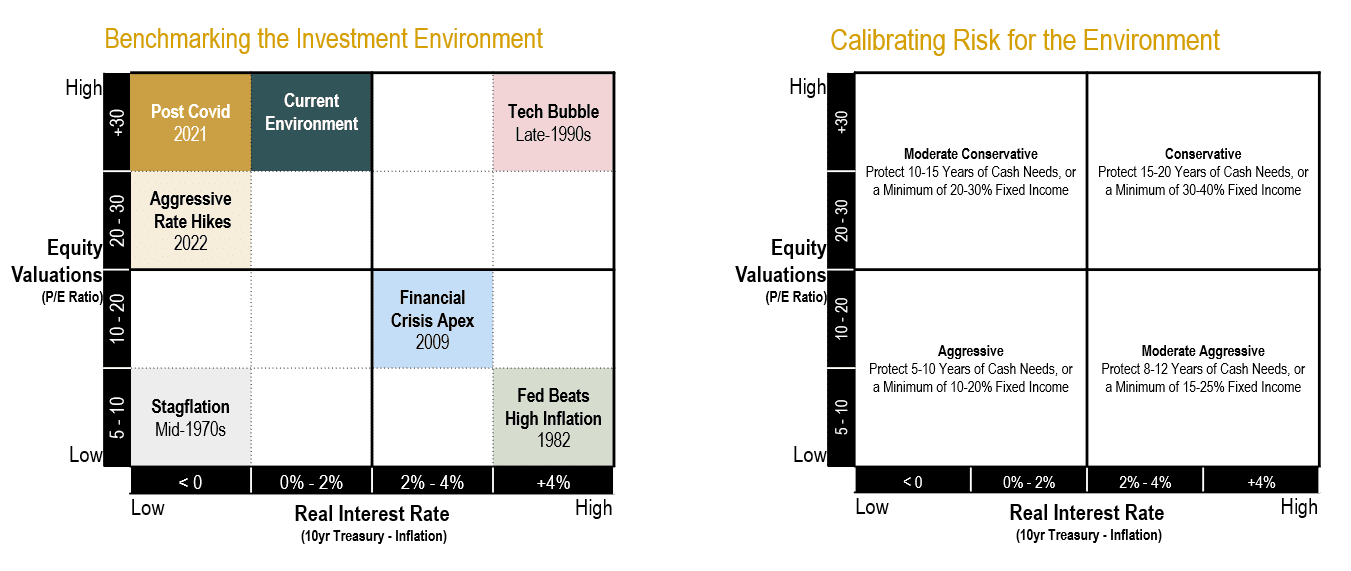
Historical stock market data reveals there is a strong inverse relationship between starting equity valuations and future equity returns over an intermediate time frame of 10-15 years. When starting valuations are low, future returns tend to be above average, and vice versa. Historical bond market data reveals a strong positive relationship between current yields and future fixed income returns. For example, an investor who buys a 5-year bond yielding 5% can expect to earn very close to 5% per year over the term of the bond (the only unknown component to the nominal return of a fixed income security held to maturity is the future interest rate at which income is assumed to be reinvested). Using this information, we benchmark the current investment environment by deriving absolute return expectations for fixed income and equity markets in isolation as well as relative return expectations between the two asset types (since asset classes are competing against each other for our dollars via expected returns). This exercise helps us determine our portfolio positioning (i.e. the percentage weights of fixed income and equity securities) when equity valuations are high/low and real (inflation-adjusted) interest rates are high/low.
The diagram on the left illustrates how we characterize the investment environment using a quadrant chart with inflation-adjusted treasury yields on the horizontal axis and equity valuations on the vertical axis. Along each axis, we denote the breakpoints used for segmentation; and within each quadrant we identify at least one period that stands out as having historical significance. We then calibrate our allocation positioning according to the quadrant chart on the right. When equity valuations are low (bottom half), we want increased exposure to stocks, all else equal. When real interest rates are high (right half), we want increased exposure to bonds, all else equal. Importantly, we consider allocation adjustments when there are changes in the relative attractiveness of fixed income and equity market segments.
Key Takeaway(s): Over the past several years, the investment environment has migrated laterally from the upper left quadrant (characterized by high equity valuations and negative real interest rates) towards the center—an environment still characterized by high equity valuations, but with fixed income yields that now offer a positive real rate of expected return.
On balance, we continue to believe a moderate conservative stance towards risk in our portfolio positioning is appropriate. However, we have continued to expand our investment team and expertise in private markets, which has created opportunities for us to adjust the composition of our portfolios, even as we maintain our relative portfolio weights to fixed income and equities.
By expanding our expertise in and access to opportunities in private credit, private equity, venture capital, and private real estate, we hope to further expand our opportunity set beyond public markets and enhance investment returns for clients. Looking ahead to 2025, we are expecting to adjust the composition of our fixed income allocations with the addition of opportunities in private credit in late Q1 or early Q2. And we expect to offer opportunities in private equity, venture capital, and private real estate through our MultiStrategy Fund Series, with our second fund becoming available in Q1 after a successful capital raise for Fund I in 2024.
Brighton Jones LLC (Brighton Jones) is an SEC-registered investment advisory firm established under the Investment Advisers Act of 1940. SEC registration does not constitute an endorsement of Brighton Jones by the SEC, nor does it indicate that the advisor has attained a particular level of skill or ability.
The information presented here is not specific to any individual’s personal circumstances and, as such, may not be suitable for all individuals. The information is presented by Brighton Jones for general information and educational purposes only, and it is not intended to provide legal, tax, accounting or investment advice. Please consult your attorney, tax professional, or other advisor regarding your specific legal, tax, accounting or investment situation. Opinions expressed are Brighton Jones’s present opinions only. The material is based upon information which Brighton Jones considers reliable, but does not represent such information is accurate or complete, and it should not be relied upon as such. This information is current and subject to change. This presentation contains forward-looking statements, predictions and forecasts (“forward-looking statements”) concerning our beliefs and opinions in respect of the future. Forward-looking statements necessarily involve risks and uncertainties, and undue reliance should not be placed on them. There can be no assurance that forward-looking statements will prove to be accurate, and actual results and future events could differ materially from those anticipated in such statements.
This presentation does not include the performance of any Brighton Jones client portfolio.
PAST PERFORMANCE IS NOT A GUARANTEE OF FUTURE RESULTS. ALL INVESTMENTS INVOLVE RISK, INCLUDING THE LOSS OF PRINCIPAL. Different investments involve varying degrees of risk, and there can be no assurance that any specific investment or investment strategy (including those recommended by Brighton Jones) will be profitable for an investment portfolio. Yields and returns will fluctuate as market conditions change.
Indices are unmanaged and do not reflect the deduction of management fees, brokerage or other commissions, exchange fees or any other expenses a client would have to pay. Investors cannot invest directly in indices.


