Time to Worry? What an Inverted Yield Curve Does and Doesn’t Mean
On March 22, 2019, the yield on 10-year treasury bonds dipped below the yield of 3-month treasury bills for the first time since 2007. When long-term bonds offer lower yields than short-term bonds, the yield curve is said to be inverted (as opposed to being described as normal).
This development is seen as noteworthy by economists, investors, and the financial media because the yield curve inverted before each of the last seven recessions in the United States (dating back to 1970).
The History of Inverted Yield Curves
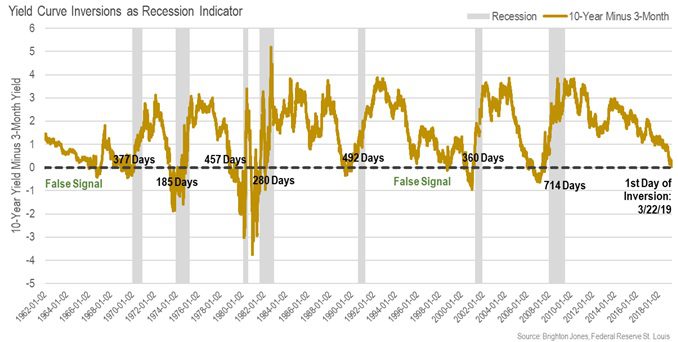
To illustrate, the chart below plots the 10-year treasury yield minus the 3-month treasury yield (yellow line) with recessionary periods highlighted in gray. When the yellow line falls below zero, the yield curve is inverted—and we can see this indeed happened prior to each recession in the period shown.
Along the horizontal axis, we further indicate the number of days that passed between the date the yield curve first became inverted and the start date of the next recession. While yield curve inversions have preceded each of the last seven recessions, an important caveat is that inversions have not reliably indicated when a recession would eventually start. For example, the yield curve inverted about six months before the recession in 1973, but it inverted nearly two years before the start of the last recession in 2008.

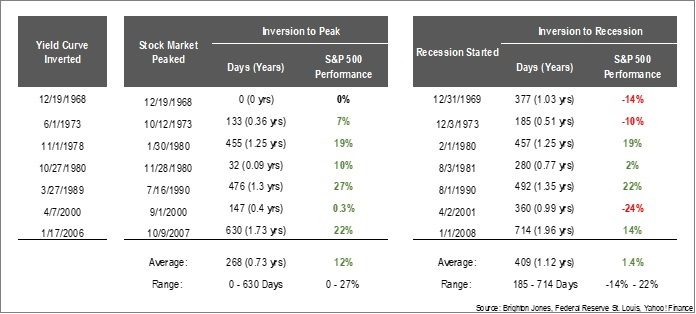
Of course, for investors, a reasonable question to ask is whether a yield curve inversion might be a good indication to move out of the stock market (since it is a leading indicator of economic activity). According to our research—summarized in the table below—the answer is, conclusively, no.
In six of the seven recessionary periods analyzed, the stock market continued to move higher after the yield curve first became inverted. On average, the stock market pushed higher for about nine months and delivered +12 percent in gains following the first day of inversion. But, with a wide range of individual outcomes and relatively few data points, we cannot derive useful market timing rules based on these observations.
Our View
- We do not view yield curve inversions as a useful tool for timing fixed income or equity markets.
- While yield curve inversions are noteworthy developments that receive a lot of attention, it is important to note the following:
-
- The relationship between recessions and yield curve inversions has only held for seven data points in the United States (a relatively small sample size).
- During our analysis period, there were two false signals where the yield curve inverted without a recession.
- A similar relationship between yield curve inversions and recessions has not been present in international markets (we typically discount statistical findings that are not pervasive across markets).
- It is important to consider how predictions (especially based on statistics) can exert influence upon predicted events. That is, if policymakers view an inverted yield curve as a reliable recession indicator that provides 6-24 months of advance warning, then they should have ample time to adjust policy measures to be more accommodative with the hope of preventing a recession. For this reason, we question whether this indicator will continue to work in the future as it has in the past (even if it remains a useful data point for policy decisions).
- We are not making any adjustments to our allocation model at this time as a result of this development.
Read more from our blog:


