The Normalcy of Volatility
Volatility returned to global equity markets and long-term bond yields plummeted following an unexpected rise in the unemployment rate to 4.3% for July, up from 4.1% in June, as reported by the US Bureau of Labor Statistics on Friday. The surprise reading came two days after the Federal Reserve opted to maintain its current interest rate policy, keeping the Fed Funds rate within a range of 5.25% to 5.50%.
Concerns that the Federal Reserve might have erred by keeping short-term interest rates too high for too long is leading investors to reevaluate the potential risk of a more severe economic downturn than the previous base case scenario. Within minutes of financial markets opening on Monday morning, US stocks were trading nearly 10% below recent highs while the yield on 10-year Treasuries had sunk to a low of 3.68%. However, as the morning progressed, both equity markets and bond yields moved well off their lows.
The normalcy of volatility
We have all heard the lessons of sound investing over and over, but admittedly, it is never easy to adhere to a long-term plan in the face of short-term uncertainty. For investors, however, the difference between success and failure generally lies in the execution of a plan and adherence to a process, particularly during periods of heightened volatility. In turn, simply knowing what to expect in terms of volatility is a critical ingredient to staying committed over the long term.
Given US equity investors have enjoyed an extended period of upward moving markets, it may be timely to revisit what we call the normalcy of volatility. Consider the 45 years of history illustrated in the chart below, with maximum intra-year price declines (orange markers) plotted against calendar year total returns (blue bars) for the S&P 500 Index:
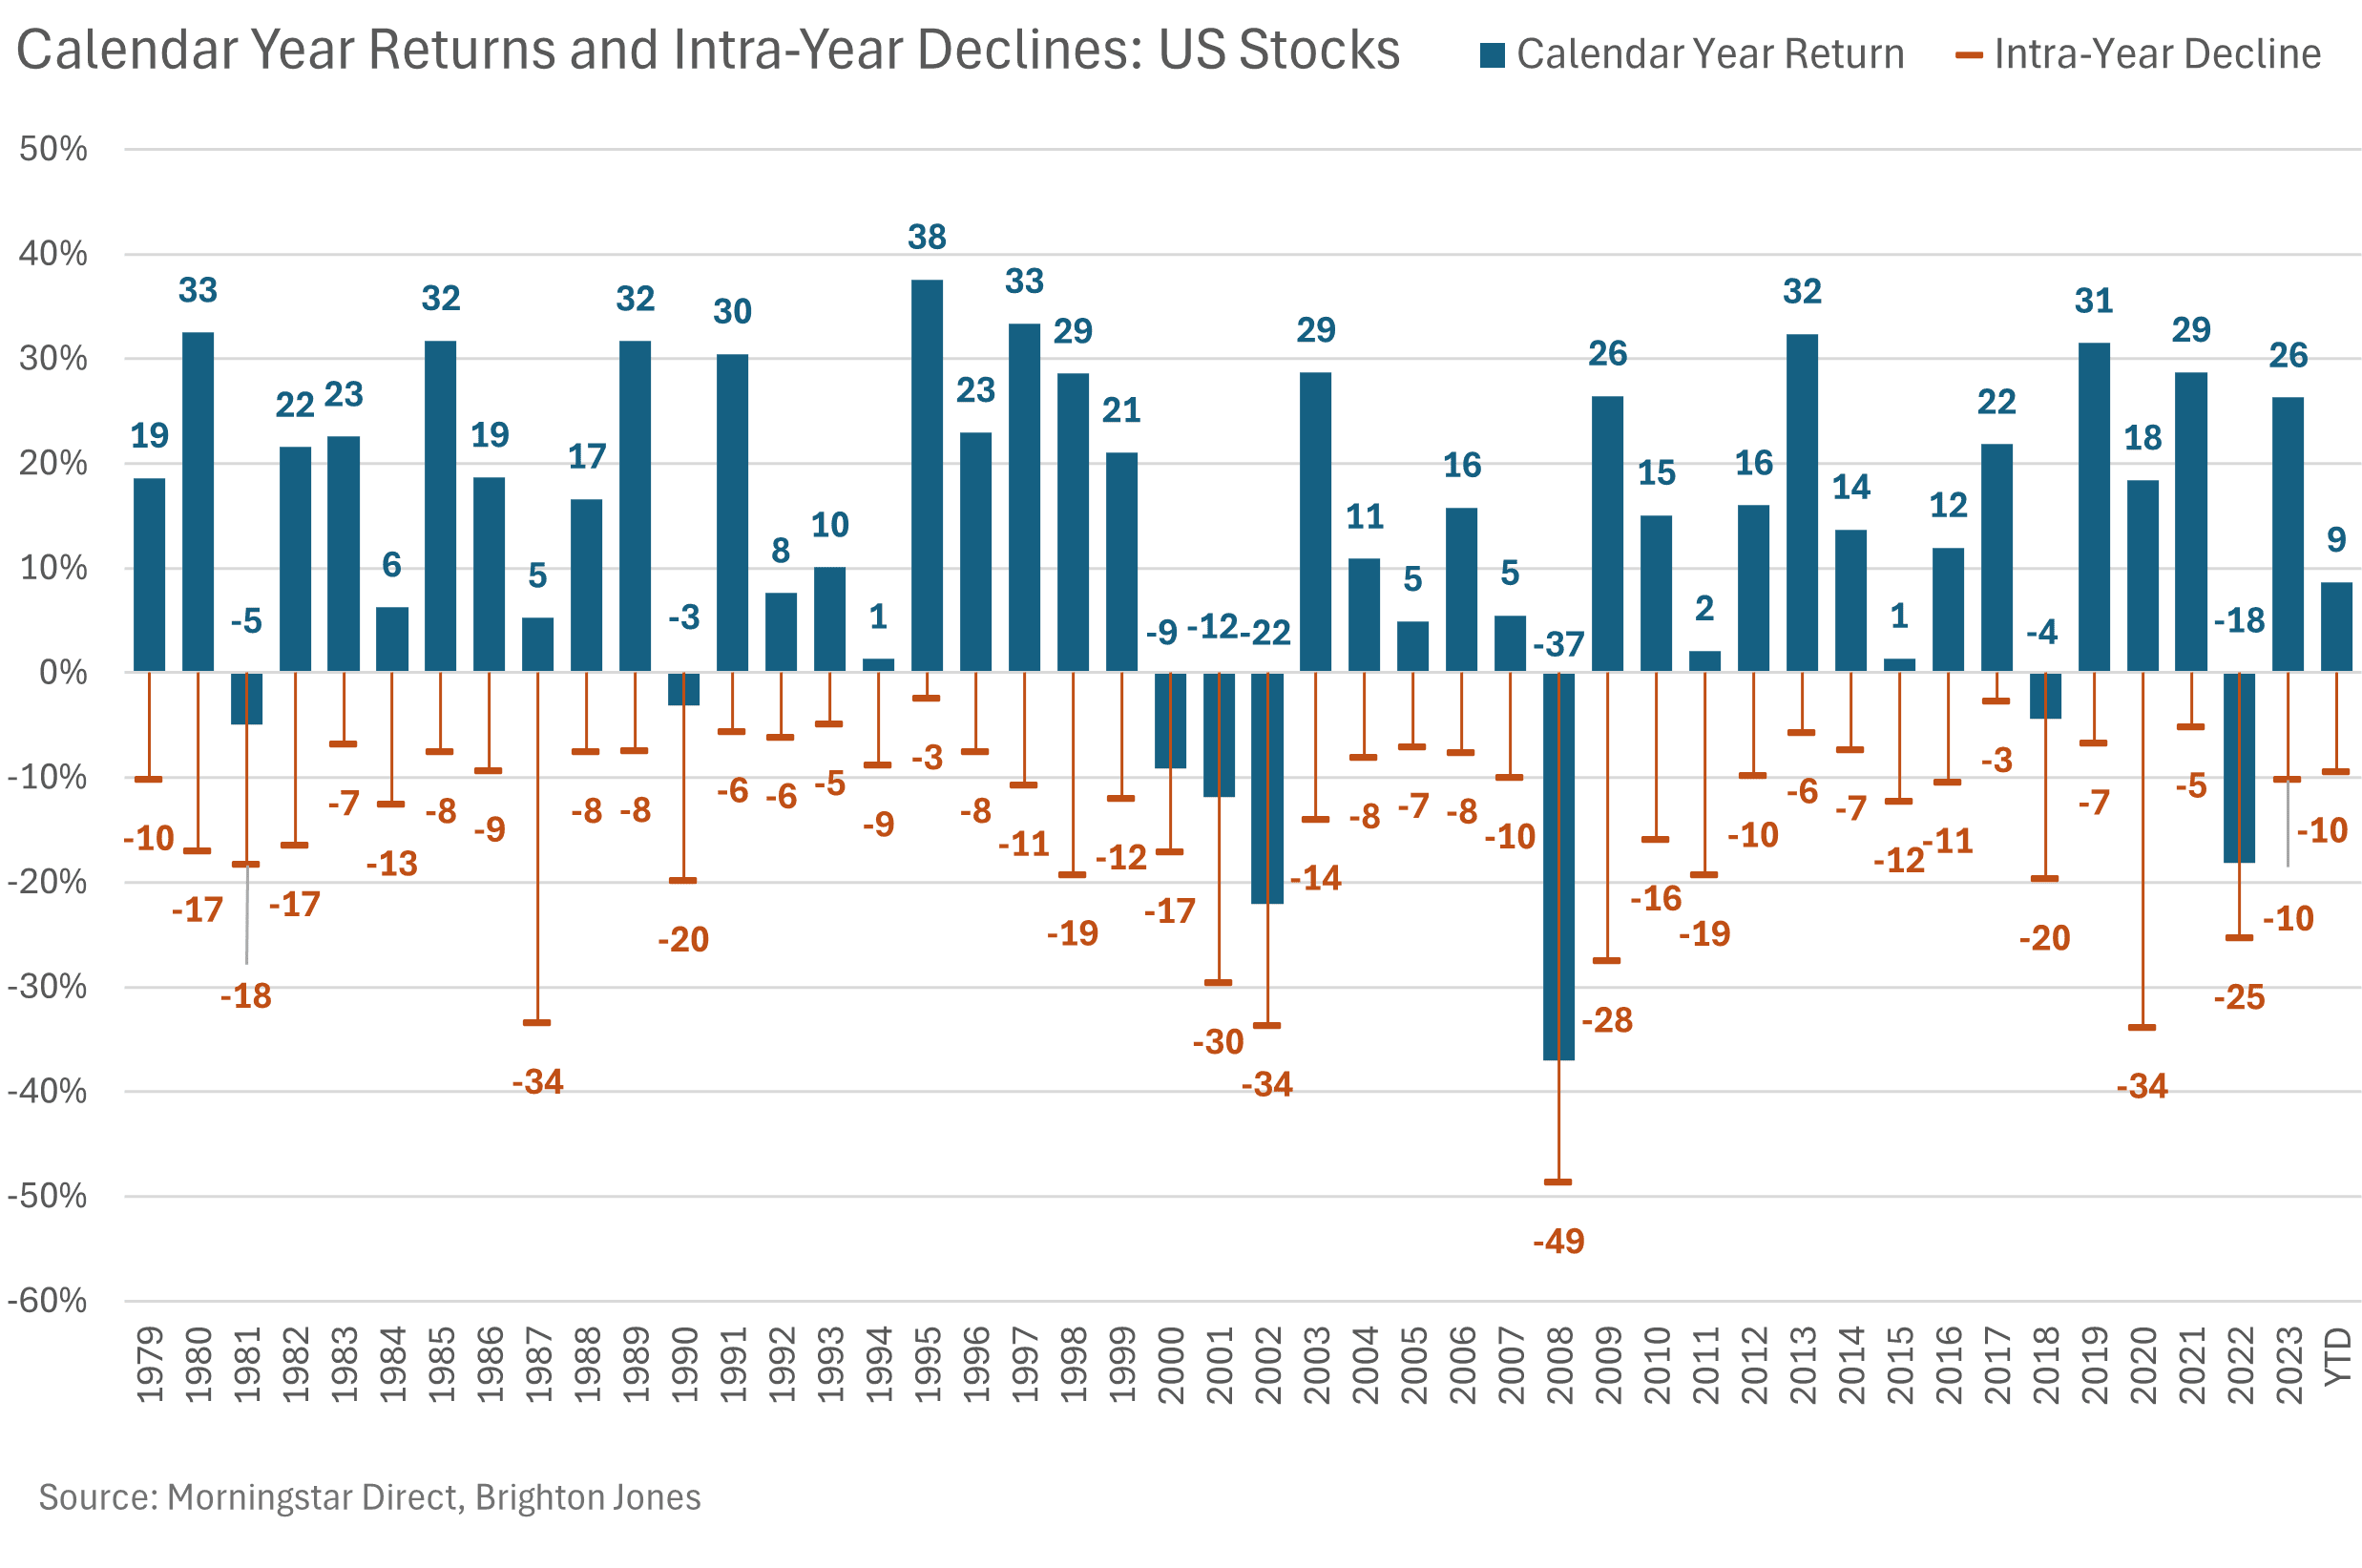
There are several interesting data points to note:
- Since 1979, the average of intra-year price declines has been 14%.
- Intra-year price declines have ranged from 2.5% (1995) to 49% (2008).
- It is not uncommon for the market to go several years without a double-digit price decline. In fact, the longest the S&P 500 Index went without a 10% correction during the analysis period was 2,553 calendar days from October 1990 to October 1997.
- Despite frequent bouts with volatility, the S&P 500 Index enjoyed a 12.12% compound annual growth rate (including reinvested dividends) during the analysis period.
The most important conclusion we can draw from this illustration and the underlying data is that market pullbacks are normal, and so we must plan accordingly. That is, the only regularity in the data is that pullbacks happen; given equity markets can go several years without experiencing a meaningful decline and given the range of annual pullbacks is so wide, we cannot derive a reliable trading rule to navigate around them. Thankfully, history suggests that investors are rewarded for their willingness to put capital at risk over the long term.
The information and analysis contained in this document is for general informational purposes only and should not be construed as specific investment advice. For investment advice, please consult with your adviser.