What to Expect When You’re Expecting Returns, Part II
With every market cycle producing different winners and losers on a relative basis, many investors inevitably find themselves second-guessing one or more positions in their portfolio. While most investors intuitively understand that they should not place all of their eggs in one basket, holding a globally diversified investment portfolio also comes with challenges. Because some part of a broadly diversified portfolio will always produce disappointing results, some behavioral economists quip that diversification is the strategy of maximum regret.
For the diversified investor, the challenge is overcoming the conflicting feelings we are sure to encounter when retaining and potentially adding to asset classes after inevitable periods of disappointing results, despite the documented benefits of doing so over time.
Read more: What to Expect When You’re Expecting Returns, Part I
Of course, one key to overcoming unproductive behavioral tendencies and emotional challenges is to reduce the potential for surprising outcomes. With that in mind, we created two charts1 to answer one simple question: over time, how much variance should we expect to see between the best and worst performing asset classes within a broadly diversified portfolio?
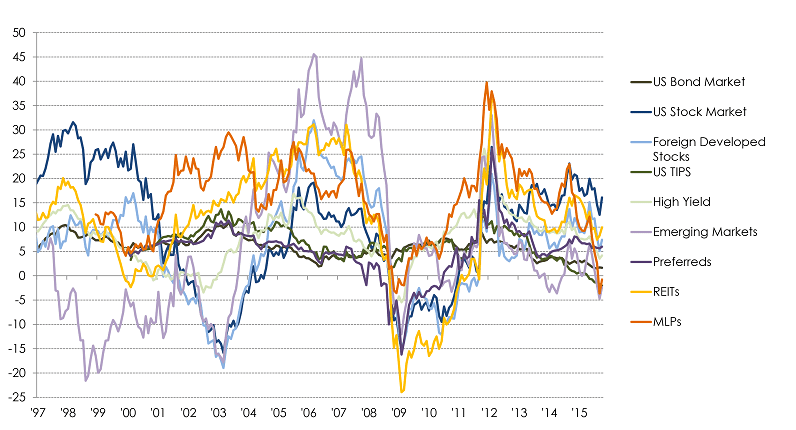
To answer this question, we first plotted the rolling 3-year returns of the individual asset classes included in our portfolios. When looking at this chart, don’t try to follow the individual lines. Instead, just pick random points along the x-axis and visually gauge the difference between the best and worst performers. As you will see, there is quite a wide range of returns at nearly every point in time!
Asset Class Performance: Rolling 3-Year Returns

With every market cycle producing different winners and losers, many investors inevitably find themselves second-guessing one or more positions in their portfolio.
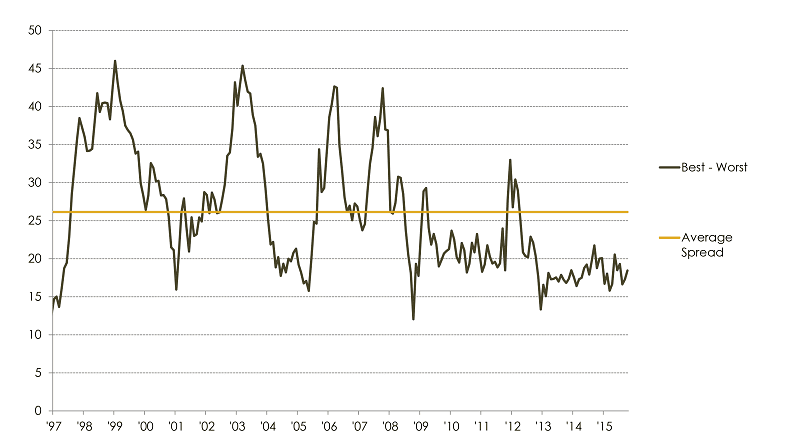
To simplify the previous illustration, we subtracted the returns of the worst performing asset class from the best performing asset class at each point in time. This illustration reveals that we should expect to see a difference of ~27% on average between the best and worst performing portfolio components, and, it would not be unprecedented to see the performance delta stretch to as much as 45%. Again, this goes to show there will always be something you wish you owned more of and something you wish you owned less of as a diversified investor.
Asset Class Performance: Best – Worst, Rolling 3-Year Returns
Most investors intuitively understand the importance of diversification. Nevertheless, it is difficult for most to accept that some portion of their portfolio will produce disappointing results and nothing can be done to reliably avoid this fate. Despite the unpredictable fortunes of individual asset classes—with some performing well and others performing poorly—investors who remain committed and disciplined to a diversified investment strategy can earn the returns they need to achieve their goals.
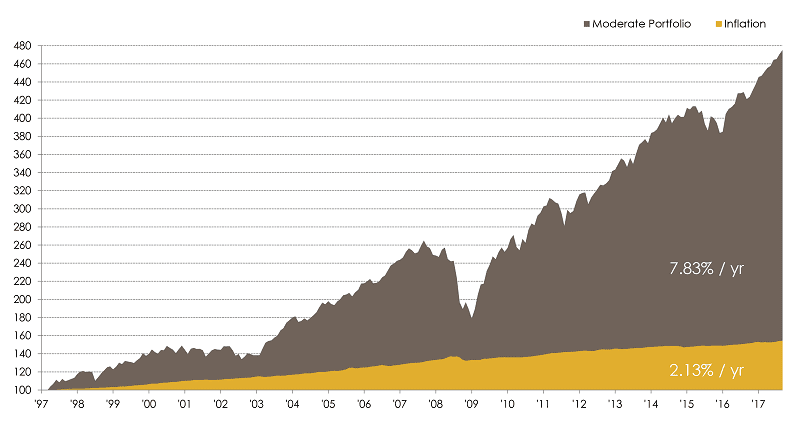
As illustrated below2, a hypothetical moderate risk portfolio diversified across the full spectrum of asset types and rebalanced annually performed admirably over the past two decades, returning 7.89% per year versus inflation of 2.12% (despite encountering two of the most severe bear markets in modern financial history).
Growth of $100: Diversified Portfolio vs. Inflation
Read more from our blog:
- What to Expect When You’re Expecting Returns, Part I
- Bitcoin: It’s Probably Not What You Think It Is
- Political Uncertainty and Investments: Is My Portfolio Safe?
- Why Conventional Wisdom on Manager Selection is Wrong
1 Source: Brighton Jones, Zephyr, Morningstar
2 Moderate Portfolio (30% capital preservation): 30% US Bonds, 19.1% S&P 500, 12.75% Small/Mid, 13.72% World ex US, 2.625% High Yield, 3.15% TIPS, 3.43% Emerging Mkts, 2.625% Preferreds, 4.2% Global REITS, 3.15% MLPs, 2.625% Leverage Loans. Source: Brighton Jones, Zephyr, Morningstar


